The Problem With Being Normal

Many of us remember the desperate desire to fit into the crowd during our formative years, perhaps even to the point of doing things that in retrospect were not such a clever idea (I’m lookin’ at you, Barbed Wire Tattoo). And then, as we get a bit older and wiser, with the benefit of varying amounts of soul-searching adventures and therapy, we discover that we’re unique and that in order to thrive or even be well enough to function, we need different things (hours of sleep, types of exercise, cups of coffee) from our peers. Different strokes for different folks, and all that.
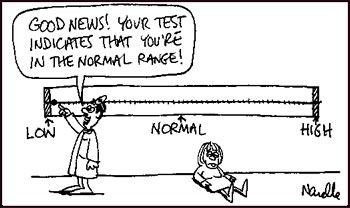
So when you have a health problem that brings you to the doctor, who’s kind enough to investigate by jabbing you in the arm and running some blood tests, what you really want to know is if there’s anything out of kilter that would explain your symptoms and suggest a course of action so you can get better. But when the results come back and the doctor tells you ‘everything is fine,’ what she’s actually telling you is not that there’s nothing in the results that’s off and could potentially explain why you’re unwell. No, the doctor is really saying is how ‘normal’ your result are, not whether they’re good or healthy. She’s basically answering the question: are you a biochemical cool kid or a clinical weirdo?
But of course, you don’t care if your results are ‘average’ or ’normal.’ You want to get better, gosh darn it. I mean, is ‘normal’ even good? Does it mean that you’re healthy? Well, for most lab markers we have no idea but most research suggests: not really.
What does it mean to be normal?
A normal result for a given blood marker is one that falls within something called a ‘reference range.’ And what you might expect, indeed what we would all hope, is that this reference range is a reasonably evidence-based demarcation separating the sick from the well, the symptomatic from the symptom-free, the high-risk patients from those who are in the clear. Falling within the reference range should mean that everything’s likely to be working well.
But rather than being based on scientifically-assessed salubrious human function, a reference range is actually based on a statistical calculation indicating ‘two standard deviations from the mean giving a 95% confidence interval.’
In English, this means that based on a small group of apparently healthy people, according to statistical calculations, the lab reckons that 95% of the population (which may be separated by sex or age group) fall within the reference range for a given marker. And with some exceptions, this all that a reference range is, no more, no less. Having a result in the range doesn’t mean that you’re healthy, it says that your ‘normal,’ you fit in with crowd.

So what’s the problem?
It may not be immediately apparent, but there are a few major problems with judging your health primarily by whether or not it falls within a 95% confidence interval of the average.
Problem 1 – Lack of Standardisation
Normal for Norfolk
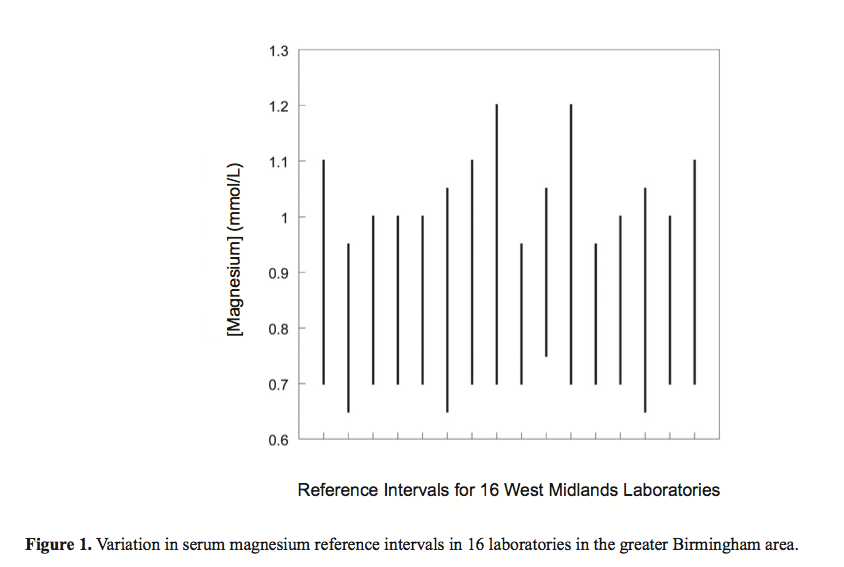
The first biggie is that different labs have different reference ranges. No, seriously. You could be given the all clear in Kesington but started on meds in Kidderminster based on where the doc shipped your blood to.
Just to illustrate how ridiculous this is, here is a graph showing ‘normal ranges’ for serum magnesium levels for 16 different Birmingham based laboratories. Depending on where your sample was sent and the blood marker in question, your doctor might equally give you an urgent referral or the all clear!! 1

Problem 2 – ‘Normal’ doesn’t mean ‘healthy’
A reference range may be the lab’s best guess at where to find 95% of everyone’s results for a given marker, but does being in that range really mean that you’re healthy? Sure, the lab created its ranges based on ‘apparently healthy’ people, but I consider that too vague for comfort and using the average stressed, tired, possibly overweight person on the street with no formal medical diagnosis as the yardstick for my health and medical treatment does not inspire confidence. 2
For an example of how ‘normal’ is different from ‘healthy’ let’s look at the example of assessing thyroid function using TSH as a marker:
“Subclinical autoimmune thyroid disease is so common in the population (up to 40% of women have lymphocytic infiltration of the thyroid and 10–15% have thyroid autoantibodies) that laboratory reference ranges derived from testing apparently healthy subjects could easily be contaminated by diseased individuals. Indeed, if only individuals negative for antibodies against thyroid peroxidase and with no personal history of thyroid disease are tested, 95% of TSH values lie within 0·48–3·60, and the US National Academy of Clinical Biochemistry (NACB) recommends the use of such a revised normal range. Importantly, several studies have detected an increase in thyroid peroxidase antibody positivity with TSH concentrations outside the narrow range 0·2–1·9 mU/L, providing evidence that TSH in the upper reference range is often associated with abnormal pathology in the thyroid.” 3
The standard reference range used for most of my patients by their doctors for TSH is .3 – 5 mU/L and it’s very common that I see patients whose results fall within this range but are still sick (and on further investigation do have thyroid problems). So they’re sick, but at least they’re normal, so they have that going for them, which is nice.
And who says that using a 95% confidence interval is more clinically relevant than a 92% or 96% CI? Because it would change how you’re treated (and often, whether or not you ended up on medication), but there’s no experimental evidence to say that 95% is clinically the absolute bestest statistical calculation or that using this range for clinical decision-making will result in the best outcomes for your health.4
And then there’s the pesky issue of bio-individuality. After all, everyone’s unique. You, my friend, are a biochemical snowflake. You may be ‘normal’ but normal may not be good for you and if you aren’t feeling well then something’s obviously amiss. I mean, what’s a better way to choose which size shoes to wear: by selecting any size within 2 standard deviations of the mean for your age and gender? Or by picking the ones that fit your feet?! Because this is essentially what’s happening clinically – your metaphorical feet may be painfully squished into shoes three sizes too small and the data is being mis-interpreted to tell you that this isn’t a problem because your shoes are ‘normal.’ As it was so eloquently put in the Lancet over a decade ago: “. . . a test result may be abnormal for an individual but still lie within the laboratory reference range.” 5
Problem 3 – Most Lab Reference Ranges Completely Ignore Medical Research
Ok, so let’s look at an example. Serum vitamin B12 is often measured as part of a blood panel checking for anaemia, particularly in patients with fatigue, cognitive impairment or neuropathy. Ironically, though, the amount of B12 floating around in our blood, which is what this test measures, doesn’t actually give us an accurate picture of whether or not we have a B12 deficiency. I know, you’d totally think it would. But, this is because only 20% of this B12 is in a form that we can use (bound to transcobalamin) whereas the remaining 80% is in a form with no currently recognised function. To make matters more complicated, the amount of B12 floating around in the serum (outside of the cells) is not a good measure of how much B12 is actually inside of the cells, doing its thing.
A much more sensitive and accurate test to detect Vitamin B12 is to measure something called methylmalonic acid (MMA). We need vitamin B12 to convert MMA into something called succinyl-CoA. When B12 is too low, MMA builds up and becomes elevated. Elevated MMA is considered to be 98% accurate for the detection of Vitamin B12 deficiency (the main exception is folks with kidney problem). In fact, many researchers define Vitamin B12 status by using methylmalonic acid, so this is generally considered to be a much more accurate and specific way to know if we have enough B12 compared to measuring B12 directly in the blood.
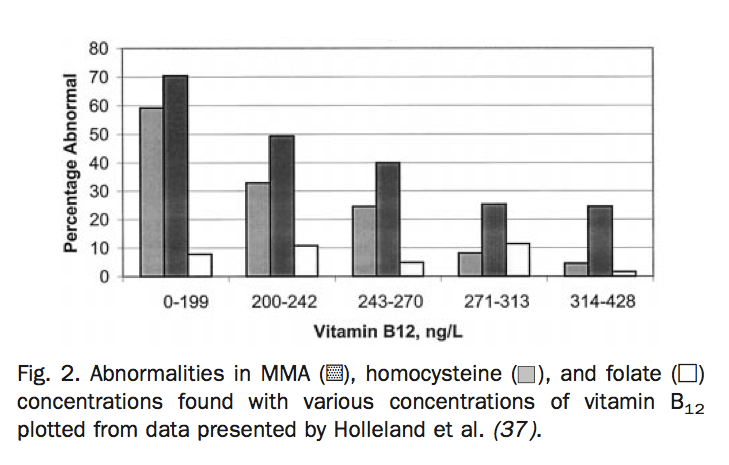
Using a reference range of serum vitamin B12 with a lower cut off <200 pg/ml (ng/L) is 50% accurate for detecting elevated levels of methylmalonic acid, which is essentially a coin toss.6 On the other hand, low Vitamin B12 levels below the lower cut off give a false positive (suggest that B12 is too low when it really isn’t) also about half the time. Not impressively accurate.

In this graph, you can see the percentage of patients who have Vitamin B12 deficiency at various concentrations of serum B12. The standard reference that I see in practice is 220 – 700 ng/L. In the graph, you can see the percentage of folks who have a B12 issue who fall within the ‘normal’ range.
So, why is this test used? Because it’s relatively cheap and that’s what they’ve always done. Most clinicians are entirely unaware that most serum B12 isn’t biologically available.7
But while it’s meant to be interpreted in the context of someone’s symptoms, the NICE Guidelines only really discuss the management and treatment of lab test confirmed B12 deficiency anaemia – in other words, it only gives guidance based on the obvious cases of B12 deficiency that are confirmed on the standard blood tests and misses the high percentage of cases where people are symptomatic but have serum B12 levels that fall within the normal range and that according to the literature would respond very well to B12 supplementation. According to this report from an NHS Hospital in Bath, anyone with a serum vitamin B12 over 180 requires no further investigation!!
And when you consider that Vitamin B12 deficiency is very common and causes heart disease, depression, dementia and irreversible neurological damage (oops!) and yet is extremely easy and inexpensive to treat when identified early, you can see the problem of using the lab defined ‘normal’ as your yardstick instead of the good old scientific literature.
Other examples like this one abound and really show a disconnect between what we know about the meaning of different lab values for human health according to the scientific literature on the one hand, and how they’re actually used in clinical practice on the other. Sometimes clinical practice guidelines are based on lab values that reflect experimental research (based on emerging research, this past June, the NHS doubled the lower reference value for serum Vitamin D, for example) but most guidelines are based on good old ‘normal,’ which cannot be considered evidence-based practice.
Take Away

One thing I strongly encourage all of my patients to do is get a printed copy of all of their test results and keep them in a binder for reference. This task can vary in levels of challenge in the UK (depending on your surgery), but is usually fairly straightforward in the US. Bottom line, you never know when it’ll come in handy and you’ll never be annoyed by having that ridiculously useful info at your very fingertips.
And the second take away is that if you are decidedly unwell and have been tested from here to there and back again and all of the results ‘are normal,’ it may be helpful to have someone do a functional interpretation of your results. Rather than compare your results to lab reference ranges, which we’ve established is not very helpful, a functional assessment compares them to what scientific research tells us is ‘healthy,’ taking into account your unique biochemistry. In the US, you can use a service like WellnessFX if you want the blood test and analysis. I run a similar test for my patients based here in the UK and I do a functional analysis for any of my patients who have recent results handy. Using this evidence based approach, we can uncover what’s going on for each individual and make an actionable plan for them to get well.
Being normal is, like, soooo over-rated.
1 Berg, J. (2012). The Approach to Pathology Harmony in the UK. The Clinical Biochemist. Reviews / Australian Association of Clinical Biochemists, 33(3), 89–93.
2 Blankenstein, M. A. (2014). Reference intervals – ever met a normal person? Annals of Clinical Biochemistry: an International Journal of Biochemistry and Laboratory Medicine, 52(1), 5–6. doi:10.1177/0004563214561563
3 Dayan, C. M., Saravanan, P., & Bayly, G. (2002). Whose normal thyroid function is better—yours or mine? The Lancet, 360(9330), 353–354. doi:10.1016/S0140-6736(02)09602-2
4 Koerbin, G., Sikaris, K. A., Jones, G. R. D., Ryan, J., Reed, M., Tate, J., & Intervals, O. B. O. T. A. C. F. C. R. (2014). Clinica Chimica Acta. Clinica Chimica Acta, 432(C), 99–107. doi:10.1016/j.cca.2013.10.021
5 Dayan, C. M., Saravanan, P., & Bayly, G. (2002). Whose normal thyroid function is better—yours or mine? The Lancet, 360(9330), 353–354. doi:10.1016/S0140-6736(02)09602-2
6 Stabler, S. P., Lindenbaum, J., & Allen, R. H. (1996). The use of homocysteine and other metabolites in the specific diagnosis of vitamin B-12 deficiency. The Journal of Nutrition, 126(4 Suppl), 1266S–72S.
7 Klee, G. G. (2000). Cobalamin and folate evaluation: measurement of methylmalonic acid and homocysteine vs vitamin B(12) and folate. Clinical Chemistry, 46(8 Pt 2), 1277–1283.

